Do you need to know, when is the best time to go to Western Sahara? Then you should take a look here, what weather you can expect there during the year.


 The climate of Western Sahara is hot and very dry, rain is very rare here. As there are cold offshore air currents, you can expect also fog and heavy dew sometimes.
 When speaking about the usual weather in this state, the information is relevant for example for these popular places: Ad Dakhla, Akhfenir, Boujdour, El Aaiún, Guelta Zemmur, Río de Oro, Saguia el Hamra, Smara.
 Let's look now what weather you can expect here. (Warning: As we don't have reliable data for this country, we use data from nearby locations for these statistics.) The warmest month here is August, the average maximum temperature is 28.2 ℃ (82.76 ℉). The average minimum temperature in this month is 21.9 ℃ (71.42 ℉). The coldest month here is January, the average maximum temperature is 20.8 ℃ (69.44 ℉). The average minimum temperature in this month is 15.4 ℃ (59.72 ℉). The most rainy month here is December, the average number of rainy days is 7.2. The least rainy month here is July, the average number of rainy days is 0.2.
 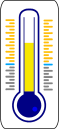 Typical (usual) weather in Western Sahara in January is this: The average highest temperature in Western Sahara in January is 20.8 ℃ (69.44 ℉). The average lowest temperature is 15.4 ℃ (59.72 ℉). At the beginning of January you can expect higher temperatures, the average highest temperature is around 21.7 ℃ (71.06 ℉). At the end of January you can expect higher temperatures, the average highest temperature is around 21.05 ℃ (69.89 ℉). The average number of rainy days in January is 5.7. The average rainfall is 16.9 mm (look here, what this number means). When planning your travel, please, keep in mind, that actual weather may differ from these average values. The length of the day at the beginning of this month is approximately 10:23 (hours and minutes), in the middle of the month 10:33 and at the end of the month 10:50.This data is approximate because we do not have exact data for this country. It is important to say, that the weather may differ significantly in different altitudes.Typical (usual) weather in Western Sahara in February is this: The average highest temperature in Western Sahara in February is 21.3 ℃ (70.34 ℉). The average lowest temperature is 15.4 ℃ (59.72 ℉). At the beginning of February you can expect lower temperatures, the average highest temperature is around 21.05 ℃ (69.89 ℉). At the end of February you can expect higher temperatures, the average highest temperature is around 21.95 ℃ (71.51 ℉). The average number of rainy days in February is 4.7. The average rainfall is 21.4 mm (look here, what this number means). When planning your travel, please, keep in mind, that actual weather may differ from these average values. The length of the day at the beginning of this month is approximately 10:50 (hours and minutes), in the middle of the month 11:11 and at the end of the month 11:35.This data is approximate because we do not have exact data for this country. It is important to say, that the weather may differ significantly in different altitudes.
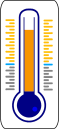 Typical (usual) weather in Western Sahara in March is this: The average highest temperature in Western Sahara in March is 22.6 ℃ (72.68 ℉). The average lowest temperature is 16.2 ℃ (61.16 ℉). At the beginning of March you can expect lower temperatures, the average highest temperature is around 21.95 ℃ (71.51 ℉). At the end of March you can expect higher temperatures, the average highest temperature is around 22.7 ℃ (72.86 ℉). The average number of rainy days in March is 3.7. The average rainfall is 9.9 mm (look here, what this number means). When planning your travel, please, keep in mind, that actual weather may differ from these average values. The length of the day at the beginning of this month is approximately 11:35 (hours and minutes), in the middle of the month 12:00 and at the end of the month 12:25.This data is approximate because we do not have exact data for this country. It is important to say, that the weather may differ significantly in different altitudes.Typical (usual) weather in Western Sahara in April is this: The average highest temperature in Western Sahara in April is 22.8 ℃ (73.04 ℉). The average lowest temperature is 16 ℃ (60.8 ℉). At the beginning of April you can expect lower temperatures, the average highest temperature is around 22.7 ℃ (72.86 ℉). At the end of April you can expect higher temperatures, the average highest temperature is around 23.3 ℃ (73.94 ℉). The average number of rainy days in April is 3.1. The average rainfall is 6.4 mm (look here, what this number means). When planning your travel, please, keep in mind, that actual weather may differ from these average values. The length of the day at the beginning of this month is approximately 12:25 (hours and minutes), in the middle of the month 12:49 and at the end of the month 13:12.This data is approximate because we do not have exact data for this country. It is important to say, that the weather may differ significantly in different altitudes.Typical (usual) weather in Western Sahara in May is this: The average highest temperature in Western Sahara in May is 23.8 ℃ (74.84 ℉). The average lowest temperature is 17.7 ℃ (63.86 ℉). At the beginning of May you can expect lower temperatures, the average highest temperature is around 23.3 ℃ (73.94 ℉). At the end of May you can expect higher temperatures, the average highest temperature is around 24.9 ℃ (76.82 ℉). The average number of rainy days in May is 1.3. The average rainfall is 1.9 mm (look here, what this number means). When planning your travel, please, keep in mind, that actual weather may differ from these average values. The length of the day at the beginning of this month is approximately 13:12 (hours and minutes), in the middle of the month 13:31 and at the end of the month 13:46.This data is approximate because we do not have exact data for this country. It is important to say, that the weather may differ significantly in different altitudes.Typical (usual) weather in Western Sahara in June is this: The average highest temperature in Western Sahara in June is 26 ℃ (78.8 ℉). The average lowest temperature is 19.1 ℃ (66.38 ℉). At the beginning of June you can expect lower temperatures, the average highest temperature is around 24.9 ℃ (76.82 ℉). At the end of June you can expect higher temperatures, the average highest temperature is around 26.75 ℃ (80.15 ℉). The average number of rainy days in June is 0.4. The average rainfall is 0.1 mm (look here, what this number means). When planning your travel, please, keep in mind, that actual weather may differ from these average values. The length of the day at the beginning of this month is approximately 13:46 (hours and minutes), in the middle of the month 13:53 and at the end of the month 13:53.This data is approximate because we do not have exact data for this country. It is important to say, that the weather may differ significantly in different altitudes.Typical (usual) weather in Western Sahara in July is this: The average highest temperature in Western Sahara in July is 27.5 ℃ (81.5 ℉). The average lowest temperature is 20.8 ℃ (69.44 ℉). At the beginning of July you can expect lower temperatures, the average highest temperature is around 26.75 ℃ (80.15 ℉). At the end of July you can expect higher temperatures, the average highest temperature is around 27.85 ℃ (82.13 ℉). The average number of rainy days in July is 0.2. The average rainfall is 0.2 mm (look here, what this number means). When planning your travel, please, keep in mind, that actual weather may differ from these average values. The length of the day at the beginning of this month is approximately 13:53 (hours and minutes), in the middle of the month 13:45 and at the end of the month 13:30.This data is approximate because we do not have exact data for this country. It is important to say, that the weather may differ significantly in different altitudes.
 Typical (usual) weather in Western Sahara in August is this: The average highest temperature in Western Sahara in August is 28.2 ℃ (82.76 ℉). The average lowest temperature is 21.9 ℃ (71.42 ℉). At the beginning of August you can expect lower temperatures, the average highest temperature is around 27.85 ℃ (82.13 ℉). At the end of August you can expect lower temperatures, the average highest temperature is around 28 ℃ (82.4 ℉). The average number of rainy days in August is 0.4. The average rainfall is 0 mm (look here, what this number means). When planning your travel, please, keep in mind, that actual weather may differ from these average values. The length of the day at the beginning of this month is approximately 13:30 (hours and minutes), in the middle of the month 13:11 and at the end of the month 12:49.This data is approximate because we do not have exact data for this country. It is important to say, that the weather may differ significantly in different altitudes.Typical (usual) weather in Western Sahara in September is this: The average highest temperature in Western Sahara in September is 27.8 ℃ (82.04 ℉). The average lowest temperature is 21.4 ℃ (70.52 ℉). At the beginning of September you can expect higher temperatures, the average highest temperature is around 28 ℃ (82.4 ℉). At the end of September you can expect lower temperatures, the average highest temperature is around 27.35 ℃ (81.23 ℉). The average number of rainy days in September is 1.8. The average rainfall is 8.4 mm (look here, what this number means). When planning your travel, please, keep in mind, that actual weather may differ from these average values. The length of the day at the beginning of this month is approximately 12:49 (hours and minutes), in the middle of the month 12:25 and at the end of the month 12:00.This data is approximate because we do not have exact data for this country. It is important to say, that the weather may differ significantly in different altitudes.Typical (usual) weather in Western Sahara in October is this: The average highest temperature in Western Sahara in October is 26.9 ℃ (80.42 ℉). The average lowest temperature is 20.5 ℃ (68.9 ℉). At the beginning of October you can expect higher temperatures, the average highest temperature is around 27.35 ℃ (81.23 ℉). At the end of October you can expect lower temperatures, the average highest temperature is around 25.6 ℃ (78.08 ℉). The average number of rainy days in October is 4.2. The average rainfall is 10.6 mm (look here, what this number means). When planning your travel, please, keep in mind, that actual weather may differ from these average values. The length of the day at the beginning of this month is approximately 12:00 (hours and minutes), in the middle of the month 11:35 and at the end of the month 11:12.This data is approximate because we do not have exact data for this country. It is important to say, that the weather may differ significantly in different altitudes.Typical (usual) weather in Western Sahara in November is this: The average highest temperature in Western Sahara in November is 24.3 ℃ (75.74 ℉). The average lowest temperature is 17.9 ℃ (64.22 ℉). At the beginning of November you can expect higher temperatures, the average highest temperature is around 25.6 ℃ (78.08 ℉). At the end of November you can expect lower temperatures, the average highest temperature is around 23.45 ℃ (74.21 ℉). The average number of rainy days in November is 6.4. The average rainfall is 21 mm (look here, what this number means). When planning your travel, please, keep in mind, that actual weather may differ from these average values. The length of the day at the beginning of this month is approximately 11:12 (hours and minutes), in the middle of the month 10:51 and at the end of the month 10:34.This data is approximate because we do not have exact data for this country. It is important to say, that the weather may differ significantly in different altitudes.Typical (usual) weather in Western Sahara in December is this: The average highest temperature in Western Sahara in December is 22.6 ℃ (72.68 ℉). The average lowest temperature is 16.3 ℃ (61.34 ℉). At the beginning of December you can expect higher temperatures, the average highest temperature is around 23.45 ℃ (74.21 ℉). At the end of December you can expect lower temperatures, the average highest temperature is around 21.7 ℃ (71.06 ℉). The average number of rainy days in December is 7.2. The average rainfall is 21.7 mm (look here, what this number means). When planning your travel, please, keep in mind, that actual weather may differ from these average values. The length of the day at the beginning of this month is approximately 10:34 (hours and minutes), in the middle of the month 10:24 and at the end of the month 10:22.This data is approximate because we do not have exact data for this country. It is important to say, that the weather may differ significantly in different altitudes.